
 the Brix (% sugar), and you will get an average of 24. On the other hand, you could crush 2 grapes together, both reading 24 Brix. At this sugar level grapes are usually close to being nicely ripe. The “average Brix” of each example would be 24. But you can imagine how different they would taste….
Listen to our PODCAST explanation of this graph.
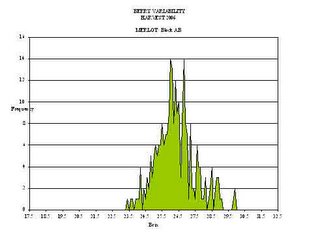
When our grapes are ready to pick, we want them as evenly ripe as possible. And Phil plans quite a bit of work in the vineyard over the year to get that evenness. So how do we know how successful we are?? Before harvest Julie will take a vineyard sample of 500 individual grapes and check the Brix of each. She inputs the data and gets statistics on the grapes. That is our
quantifiable data and feedback to the vineyard. Here is a picture of Block AB, which we will harvest tomorrow…very even in its ripeness. Tomorrow we will tell you how it looks when we are sorting it after harvest.
We have an exciting development ... Click on the link at the right for all of you that would like to subscribe to our PODCAST.
Zelma Long
